Visualizing Daml Contracts
Visualizing Daml Contracts is currently an Early Access Feature in Labs status.
You can generate visual graphs for the contracts in your Daml project. To do this:
- Install Graphviz.
- Open a terminal and navigate to your project root directory.
- Generate a DAR from your project by running
daml build -o project.dar. - Generate a dot file from that DAR by running
daml damlc visual project.dar --dot project.dot - Generate the visual graph with Graphviz by running
dot -Tpng project.dot > project.png
You can of course choose different names for the files, as long as you’re consistent between file creation and point of use.
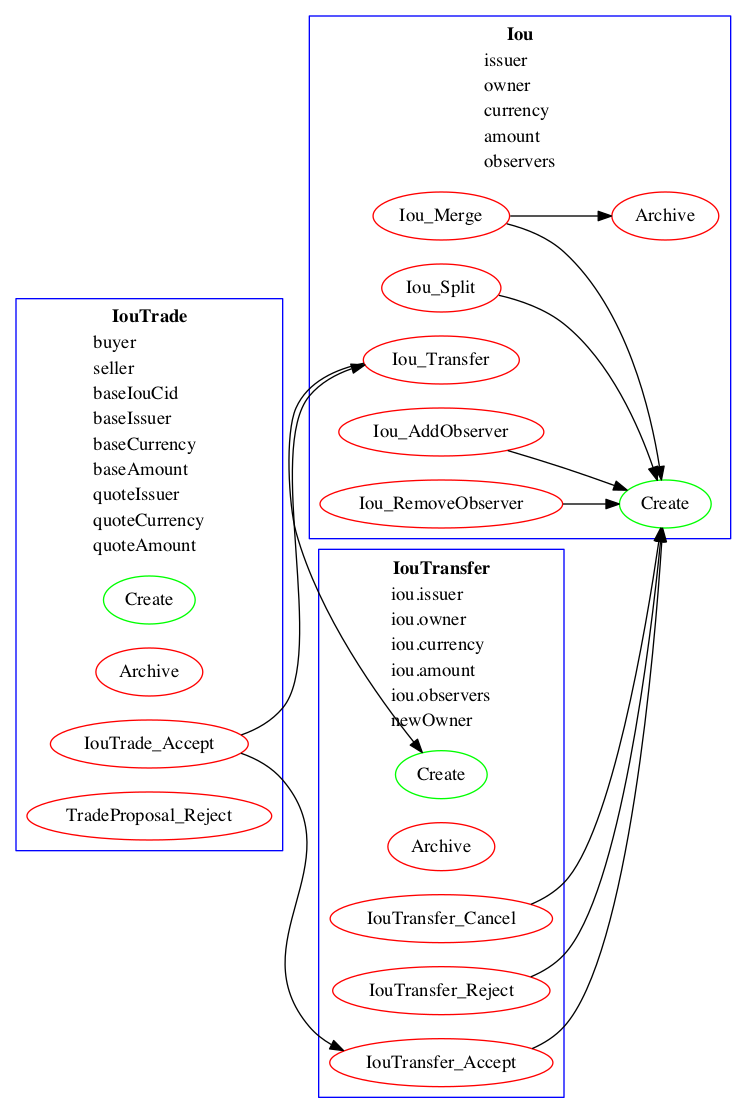
Example: Visualize the Quickstart Project
Here’s an example visualization based on the quickstart. You’ll need to install Graphviz to try this out.
- Generate the dar using
daml build - Generate a dot file
daml damlc visual dist/quickstart-0.0.1.dar --dot quickstart.dot - Generate the visual graph with Graphviz by running
dot -Tpng quickstart.dot -o quickstart.png
Running the above should produce an image which looks something like this:
Visualize Daml Contracts - Within IDE
You can generate visual graphs from VS Code IDE. Open the daml project in VS Code and use command palette. Should reveal a new window pane with dot image. Also visual generates only the currently open daml file and its imports.
Note: You will need to install the Graphviz/dot packages as mentioned above.
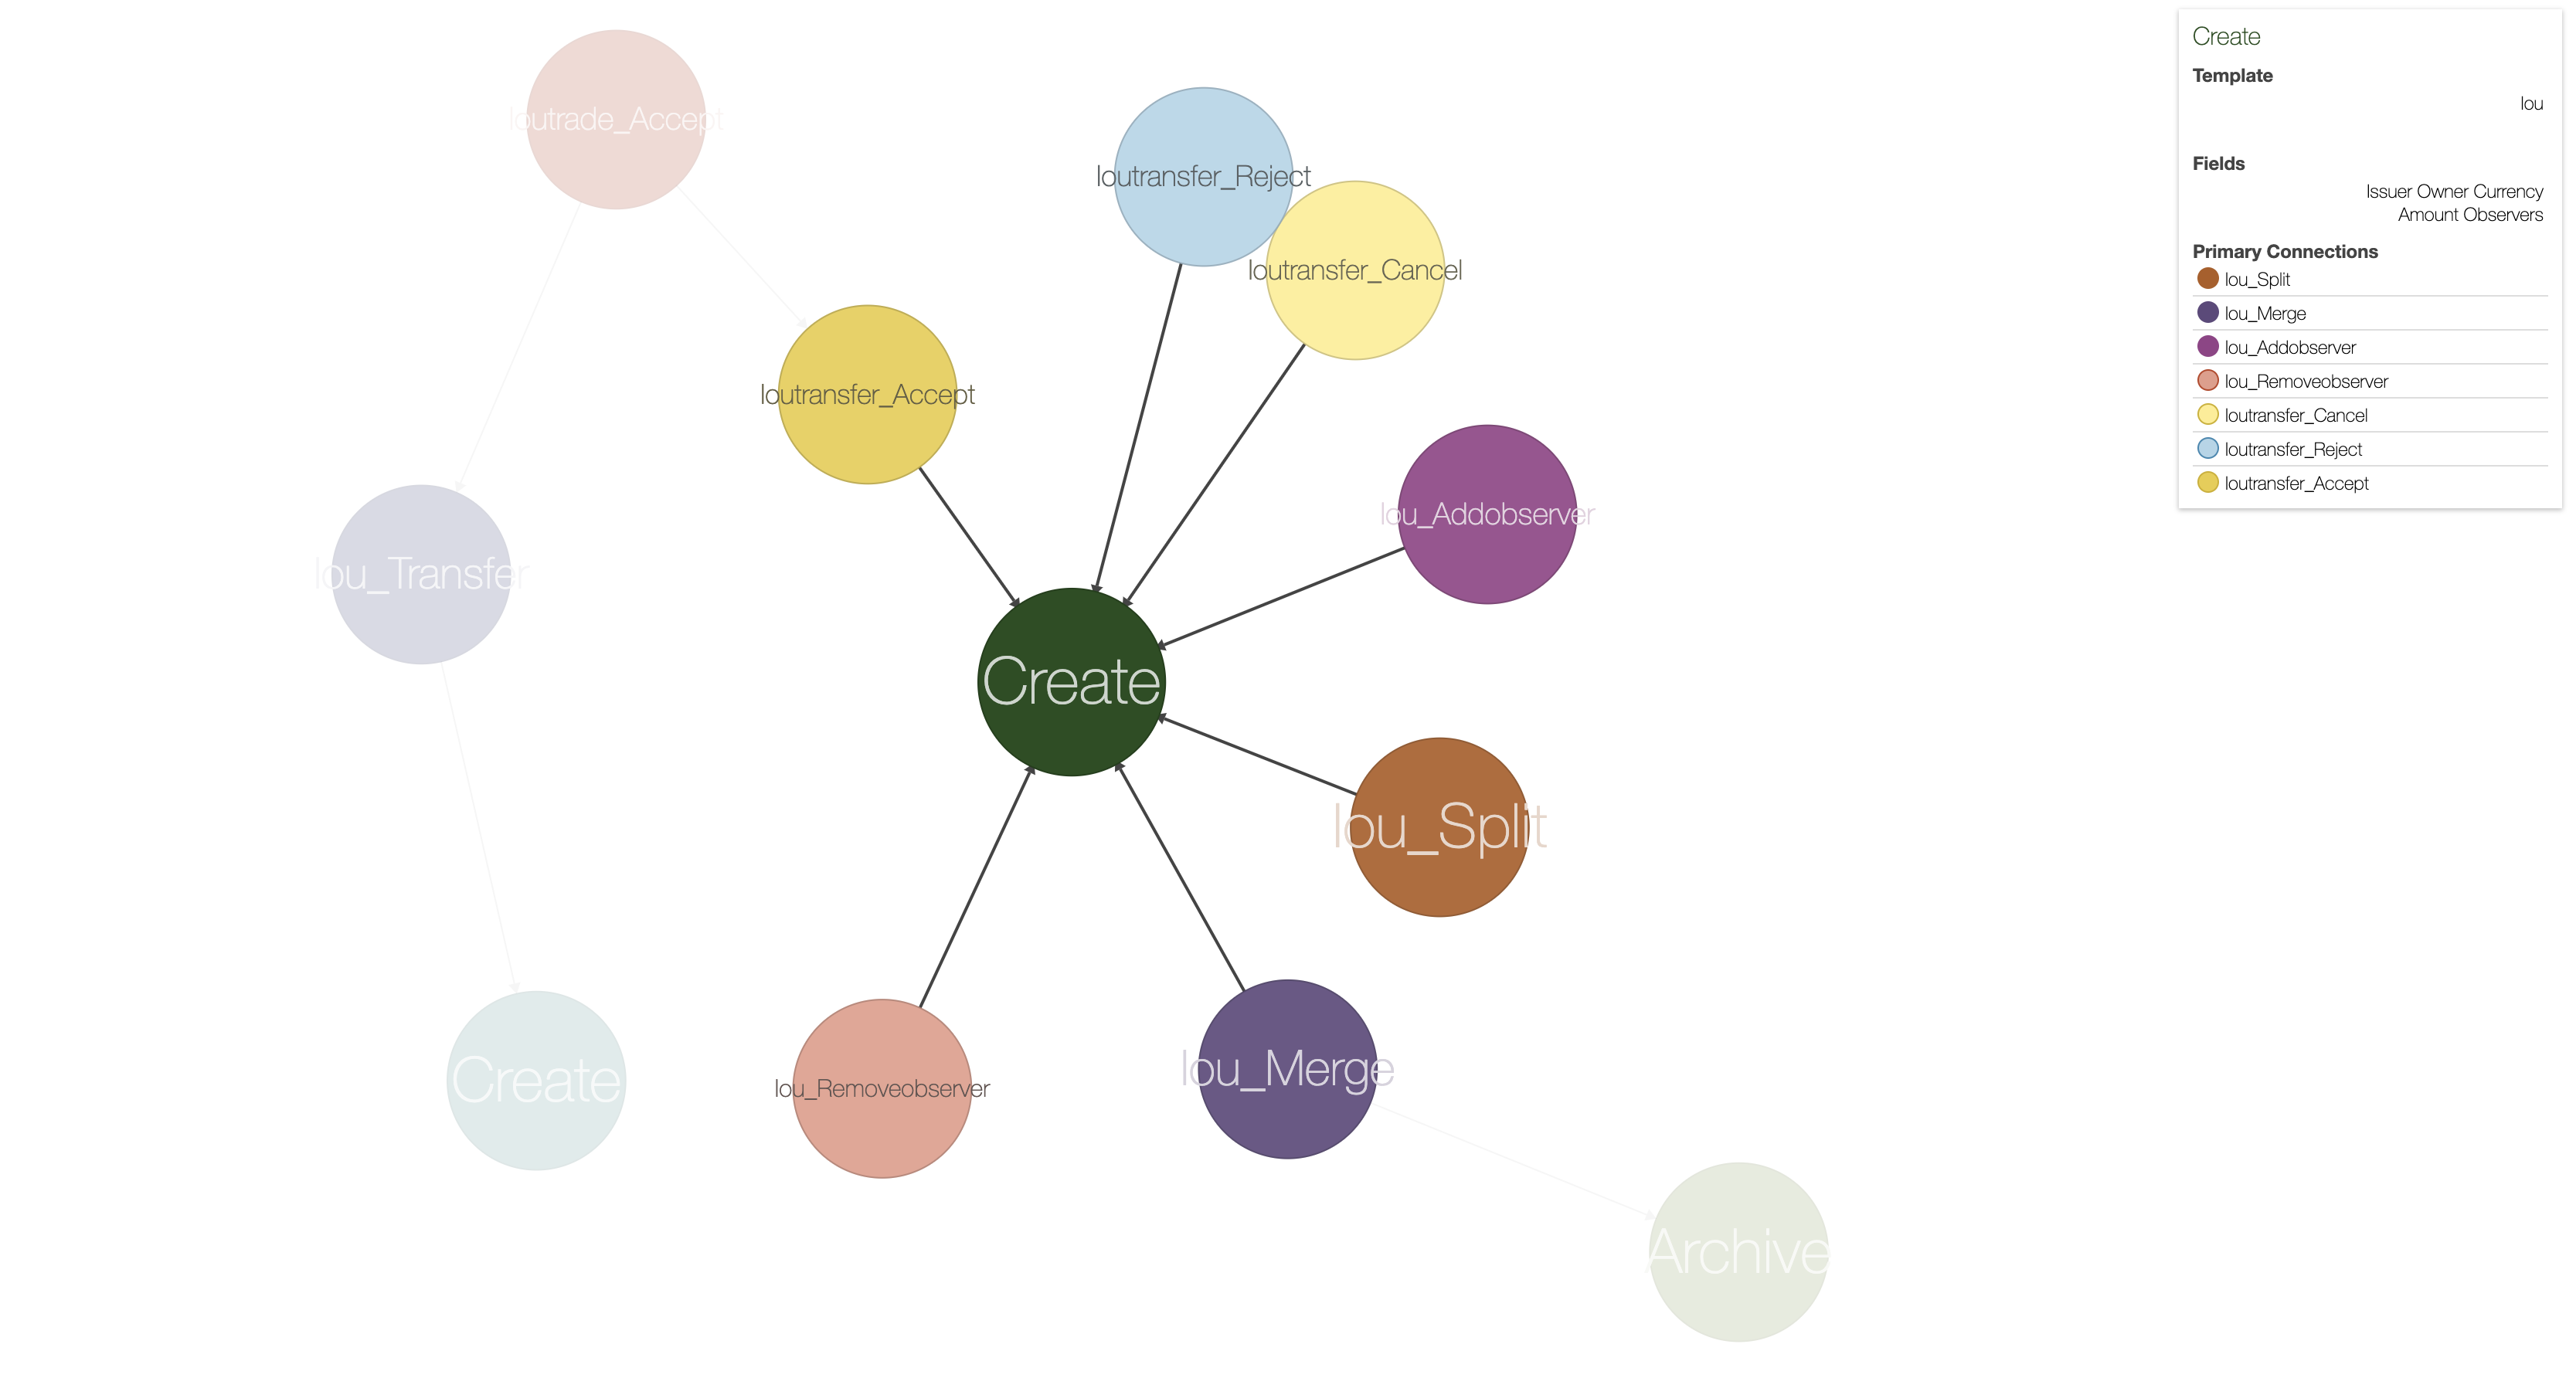
Visualize Daml Contracts - Interactive Graphs
This does not require any packages installed. You can generate D3 graphs for the contracts in your Daml project. To do this
- Generate a DAR from your project by running
daml build- Generate HTML file
daml damlc visual-web .daml/dist/quickstart-0.0.1.dar -o quickstart.html
Running the above should produce an image which looks something like this: