
Daml Profiler
The Daml Profiler is only available in Daml Enterprise.
The Daml Profiler allows you to to profile execution of your Daml code which can help spot bottlenecks and opportunities for optimization.
Usage
To test this out, we use the skeleton project included in the assistant. We first create the project and build the DAR.
daml new profile-tutorial --template skeleton
cd profile-tutorial
daml build
Next we load the DAR into Sandbox with a special profile-dir
option. Sandbox will behave as usual but all profile results will be
written to that directory. For this, we first create a configuration
file that sets the profile-dir for Sandbox:
canton.participants.sandbox.features.profile-dir = profile-results
We then pass
daml sandbox --dar .daml/dist/profile-tutorial-0.0.1.dar -c profile.conf
To actually produce some profile results, we have to create transactions. For the purposes of this tutorial, the Daml Script included in the skeleton project does the job admirably:
daml script --dar .daml/dist/profile-tutorial-0.0.1.dar --ledger-host localhost --ledger-port 6865 --script-name Main:setup
If we now look at the contents of the profile-results directory,
we can see one JSON file per transaction produced by the script. Each
file has a name of the form $timestamp-$command.json where
$timestamp is the submission time of the transaction and
$command is a human-readable description of the command that
produced the transaction (for multi-command submissions, only the
first one will be in the file name).
$ ls profile-results
2021-03-17T12:32:16.846404Z-create:Asset.json
2021-03-17T12:32:17.361596Z-exercise:Asset:Give.json
2021-03-17T12:32:17.623537Z-exercise:Asset:Give.json
At this point, you can stop Sandbox.
To view the profiling results you can use speedscope. The easiest option is to use the web version but you can also install it locally.
Let’s open the first exercise profile above 2021-03-17T12:32:17.361596Z-exercise:Asset:Give.json:
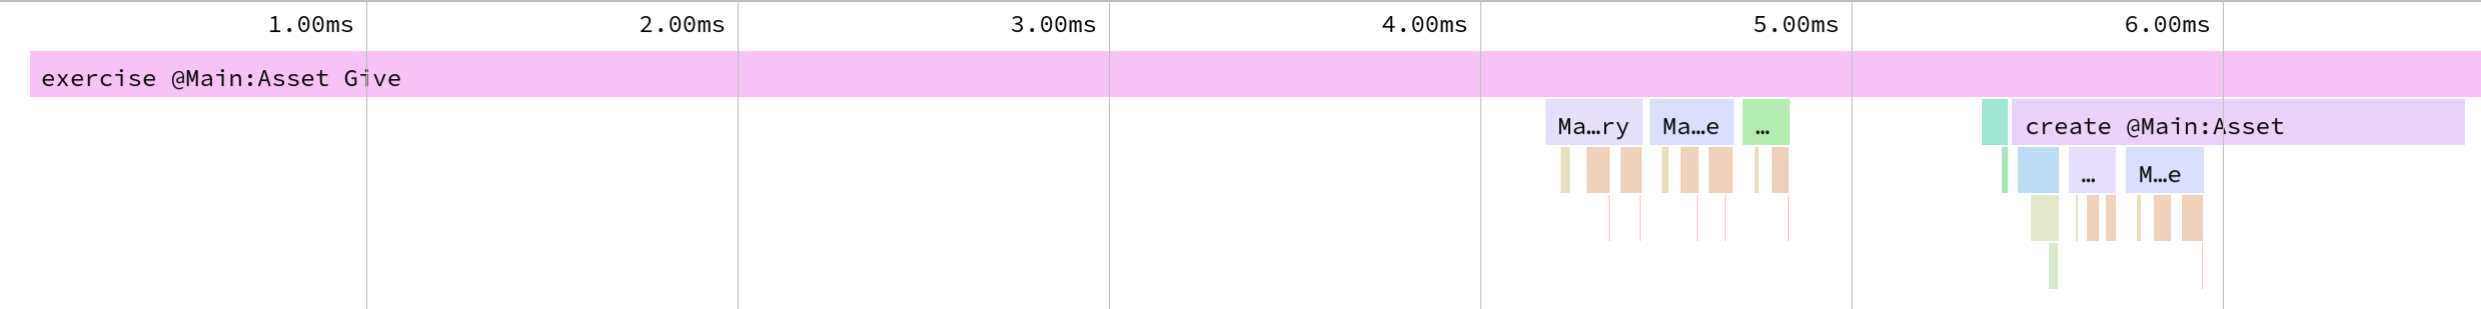
You can see the exercise as the root of the profile. Below that there are a few expressions to calculate signatories, observer and controllers and finally we see the create of the contract. In this simple example, nothing obvious stands out that we could do to optimize further.
Speedscope provides a few other views that can be useful depending on your profile. Refer to the documentation for more information on that.
Caveats
- The profiler currently does not take time into account that is spent outside of pure interpretation, e.g., time needed to fetch a contract from the database.
- The profiler operates on Daml-LF. This means that the identifiers
used in the profiler correspond to Daml-LF expressions which
includes autogenerated identifiers used by the compiler. E.g., in
the example above,
Main:$csignatoryis the name of the function used to compute signatories ofAsset. You can view the Daml-LF code that the compiler generated usingdaml damlc inspect. This can be useful to see where an identifier is being used but it does take some experience to be able to read Daml-LF code with ease.
daml damlc inspect .daml/dist/profiler-tutorial-0.0.1.dar