
Example Monitoring Setup
This section provides an example of how Canton can be run inside a connected network of Docker containers. The example also shows how you can monitor network activity. See the monitoring glossary for an explanation of the terms and the Monitoring Choices section for the reasoning behind the example monitoring setup.
Container Setup
To configure Docker Compose to spin up the Docker container network shown in the diagram, use the information below. See the compose documentation for detailed information concerning the structure of the configuration files.
compose allows you to provide the overall configuration across multiple files. Each configuration file is described below, followed by information on how to bring them together in a running network.

Intended Use
This example is intended to demonstrate how to expose, aggregate, and observe monitoring information from Canton. It is not suitable for production without alterations. Note the following warnings:
Warning
Ports are exposed from the Docker network that are not necessary to support the UI. For example, the network can allow low-level interaction with the underlying service via a REST or similar interface. In a production system, the only ports that should be exposed are those required for the operation of the system.
Warning
Some of the services used in the example (for example, Postgres and Elasticsearch) persist data to disk. For this example, the volumes used for this persisted data are internal to the Docker container. This means that when the Docker network is torn down, all data is cleaned up along with the containers. In a production system, these volumes would be mounted onto permanent storage.
Warning
Passwords are stored in plaintext in configuration files. In a production system, passwords should be extracted from a secure keystore at runtime.
Warning
Network connections are not secured. In a production system, connections between services should be TLS-enabled, with a certificate authority (CA) provided.
Warning
The memory use of the containers is only suitable for light demonstration loads. In a production setup, containers need to be given sufficient memory based on memory profiling.
Warning
The versions of the Docker images used in the example may become outdated. In a production system, only the latest patched versions should be used.
Network Configuration
In this compose file, define the network that will be used to connect all the running containers:
# Create with `docker network create monitoring`
# Note that `external: false` will fail the docker-compose execution if the network `monitoring` already exists

version: "3.8"

networks:
  default:
    name: monitoring
    external: false
Postgres Setup
Using only a single Postgres container, create databases for the sync domain, along with Canton and index databases for each participant. To do this, mount postgres-init.sql into the Postgres-initialized directory. Note that in a production environment, passwords must not be inlined inside config.
services:
  postgres:
    image: postgres:14.8-bullseye
    hostname: postgres
    container_name: postgres
    environment:
      - POSTGRES_USER=pguser
      - POSTGRES_PASSWORD=pgpass
    volumes:
      - ../etc/postgres-init.sql:/docker-entrypoint-initdb.d/init.sql
    expose:
      - "5432"
    ports:
      - "5432:5432"
    healthcheck:
      test: "pg_isready -U postgres"
      interval: 5s
      timeout: 5s
      retries: 5
create database canton1db;
create database index1db;

create database domain0db;

create database canton2db;
create database index2db;
Synchronization Domain Setup
Run the sync domain with the –log-profile container that writes plain text to standard out at debug level.
services:
  domain0:
    image: digitalasset/canton-open-source:2.5.1
    container_name: domain0
    hostname: domain0
    volumes:
      - ./domain0.conf:/canton/etc/domain0.conf
    command: daemon --log-profile container --config etc/domain0.conf
    expose:
      - "10018"
      - "10019"
      - "10020"
    ports:
      - "10018:10018"
      - "10019:10019"
      - "10020:10020"
canton {
  domains {
    domain0 {
      storage {
        type = postgres
        config {
          dataSourceClass = "org.postgresql.ds.PGSimpleDataSource"
          properties = {
            databaseName = "domain0db"
            serverName = "postgres"
            portNumber = "5432"
            user = pguser
            password = pgpass
          }
        }
      }
      public-api {
        port = 10018
        address = "0.0.0.0"
      }
      admin-api {
        port = 10019
        address = "0.0.0.0"
      }
    }
  }
  monitoring.metrics.reporters = [{
    type = prometheus
    address = "0.0.0.0"
    port = 10020
  }]
}
Participant Setup
The participant container has two files mapped into it on container creation. The .conf file provides details of the sync domain and database locations. An HTTP metrics endpoint is exposed that returns metrics in the Prometheus Text Based Format. By default, participants do not connect to remote sync domains, so a bootstrap script is provided to accomplish that.
services:
  participant1:
    image: digitalasset/canton-open-source:2.5.1
    container_name: participant1
    hostname: participant1
    volumes:
      - ./participant1.conf:/canton/etc/participant1.conf
      - ./participant1.bootstrap:/canton/etc/participant1.bootstrap
    command: daemon --log-profile container --config etc/participant1.conf --bootstrap etc/participant1.bootstrap
    expose:
      - "10011"
      - "10012"
      - "10013"
    ports:
      - "10011:10011"
      - "10012:10012"
      - "10013:10013"
participant1.domains.connect(domain0.defaultDomainConnection)
canton {
  participants {
    participant1 {
      storage {
        type = postgres
        config {
        dataSourceClass = "org.postgresql.ds.PGSimpleDataSource"
          properties = {
            databaseName = "canton1db"
            serverName = "postgres"
            portNumber = "5432"
            user = pguser
            password = pgpass
          }
        }
        ledger-api-jdbc-url = "jdbc:postgresql://postgres:5432/index1db?user=pguser&password=pgpass"
      }
      ledger-api {
        port = 10011
        address = "0.0.0.0"
      }
      admin-api {
        port = 10012
        address = "0.0.0.0"
      }
    }
  }
  monitoring.metrics.reporters = [{
    type = prometheus
    address = "0.0.0.0"
    port = 10013
  }]
  remote-domains.domain0 {
    public-api {
      address="domain0"
      port = 10018
    }
    admin-api {
      address = "domain0"
      port = 10019
    }
  }
}
The setup for participant2 is identical, except that the name and ports are changed.
services:
  participant2:
    image: digitalasset/canton-open-source:2.5.1
    container_name: participant2
    hostname: participant2
    volumes:
      - ./participant2.conf:/canton/etc/participant2.conf
      - ./participant2.bootstrap:/canton/etc/participant2.bootstrap
    command: daemon --log-profile container --config etc/participant2.conf --bootstrap etc/participant2.bootstrap
    expose:
      - "10021"
      - "10022"
      - "10023"
    ports:
      - "10021:10021"
      - "10022:10022"
      - "10023:10023"
participant1.domains.connect(domain0.defaultDomainConnection)
canton {
  participants {
    participant1 {
      storage {
        type = postgres
        config {
        dataSourceClass = "org.postgresql.ds.PGSimpleDataSource"
          properties = {
            databaseName = "canton1db"
            serverName = "postgres"
            portNumber = "5432"
            user = pguser
            password = pgpass
          }
        }
        ledger-api-jdbc-url = "jdbc:postgresql://postgres:5432/index1db?user=pguser&password=pgpass"
      }
      ledger-api {
        port = 10011
        address = "0.0.0.0"
      }
      admin-api {
        port = 10012
        address = "0.0.0.0"
      }
    }
  }
  monitoring.metrics.reporters = [{
    type = prometheus
    address = "0.0.0.0"
    port = 10013
  }]
  remote-domains.domain0 {
    public-api {
      address="domain0"
      port = 10018
    }
    admin-api {
      address = "domain0"
      port = 10019
    }
  }
}
Logstash
Docker containers can specify a log driver to automatically export log information from the container to an aggregating service. The example exports log information in GELF, using Logstash as the aggregation point for all GELF streams. You can use Logstash to feed many downstream logging data stores, including Elasticsearch, Loki, and Graylog.
services:
  logstash:
    image: docker.elastic.co/logstash/logstash:8.5.1
    hostname: logstash
    container_name: logstash
    expose:
      - 12201/udp
    volumes:
      - ./pipeline.yml:/usr/share/logstash/config/pipeline.yml
      - ./logstash.yml:/usr/share/logstash/config/logstash.yml
      - ./logstash.conf:/usr/share/logstash/pipeline/logstash.conf
    ports:
      - "12201:12201/udp"
Logstash reads the pipeline.yml to discover the locations of all pipelines.
- pipeline.id: main
  path.config: "/usr/share/logstash/pipeline/logstash.conf"
The configured pipeline reads GELF-formatted input, then outputs it to an Elasticsearch index prefixed with logs- and postfixed with the date.
# Main logstash pipeline

input {
  gelf {
    use_udp => true
    use_tcp => false
    port => 12201
  }
}

filter {}

output {

  elasticsearch {
    hosts => ["http://elasticsearch:9200"]
    index => "logs-%{+YYYY.MM.dd}"
  }

}
The default Logstash settings are used, with the HTTP port bound to all host IP addresses.
# For full set of descriptions see
# https://www.elastic.co/guide/en/logstash/current/logstash-settings-file.html

http.host: "0.0.0.0"
Elasticsearch
Elasticsearch supports running in a clustered configuration with built-in resiliency. The example runs only a single Elasticsearch node.
services:
  elasticsearch:
    image: docker.elastic.co/elasticsearch/elasticsearch:8.5.2
    container_name: elasticsearch
    environment:
      ELASTIC_PASSWORD: elastic
      node.name: elasticsearch
      cluster.name: elasticsearch
      cluster.initial_master_nodes: elasticsearch
      xpack.security.enabled: false
      bootstrap.memory_lock: true
    ulimits:
      memlock:
        soft: -1
        hard: -1
    expose:
      - 9200
    ports:
      - 9200:9200
    healthcheck:
      test: "curl -s -I http://localhost:9200 | grep 'HTTP/1.1 200 OK'"
      interval: 10s
      timeout: 10s
      retries: 10
Kibana
Kibana provides a UI that allows the Elasticsearch log index to be searched.
services:
  kibana:
    image: docker.elastic.co/kibana/kibana:8.5.2
    container_name: kibana
    expose:
      - 5601
    ports:
      - 5601:5601
    environment:
      - SERVERNAME=kibana
      - ELASTICSEARCH_HOSTS=http://elasticsearch:9200
    healthcheck:
      test: "curl -s -I http://localhost:5601 | grep 'HTTP/1.1 302 Found'"
      interval: 10s
      timeout: 10s
      retries: 10
You must manually configure a data view to view logs. See Kibana Log Monitoring for instructions.
cAdvisor
cAdvisor exposes container system metrics (CPU, memory, disk, and network) to Prometheus. It also provides a UI to view these metrics.
services:
  cadvisor:
    image: gcr.io/cadvisor/cadvisor:v0.45.0
    container_name: cadvisor
    hostname: cadvisor
    privileged: true
    devices:
      - /dev/kmsg:/dev/kmsg
    volumes:
      - /var/run:/var/run:ro
      - /var/run/docker.sock:/var/run/docker.sock:ro
      # Although the following two directories are not present on OSX removing them stops cAdvisor working
      # Maybe some internal logic checks for the existence of the directory.
      - /sys:/sys:ro
      - /var/lib/docker/:/var/lib/docker:ro
    expose:
      - 8080
    ports:
      - "8080:8080"
To view container metrics:
- Navigate to http://localhost:8080/docker/.
- Select a Docker container of interest.
You should now see a UI similar to the one shown.
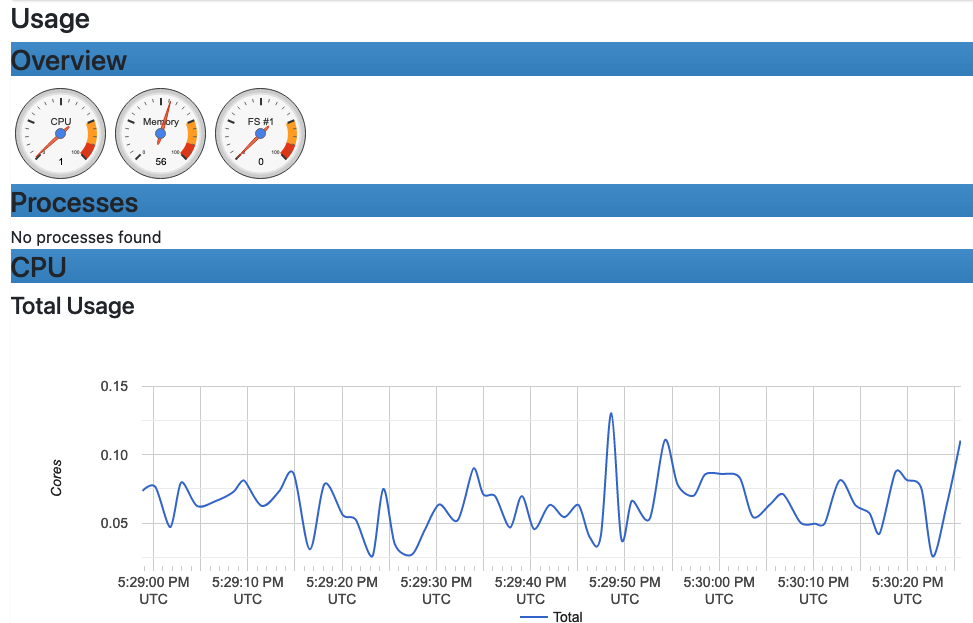
Prometheus-formatted metrics are available by default at http://localhost:8080/metrics.
Prometheus
Configure Prometheus with prometheus.yml to provide the endpoints from which metric data should be scraped. By default, port 9090 can query the stored metric data.
services:
  prometheus:
    image: prom/prometheus:v2.40.6
    container_name: prometheus
    hostname: prometheus
    volumes:
      - ./prometheus.yml:/etc/prometheus/prometheus.yml
    ports:
      - 9090:9090
global:
  scrape_interval: 15s
  scrape_timeout: 10s
  evaluation_interval: 1m

scrape_configs:

  - job_name: canton
    static_configs:
      - targets:
        - domain0:10020
        - participant1:10013
        - participant2:10023

  - job_name: cadvisor
    static_configs:
      - targets:
        - cadvisor:8080

    # Exclude container labels by default
    # curl cadvisor:8080/metrics to see all available labels
    metric_relabel_configs:
      - regex: "container_label_.*"
        action: labeldrop
Grafana
Grafana is provided with:
- The connection details for the Prometheus metric store
- The username and password required to use the web UI
- The location of any externally provided dashboards
- The actual dashboards
Note that the Metric Count dashboard referenced in the docker-compose.yml file (grafana-message-count-dashboard.json) is not inlined below. The reason is that this is not hand-configured but built via the web UI and then exported. See Grafana Metric Monitoring for instructions to log into Grafana and display the dashboard.
services:
  grafana:
    image: grafana/grafana:9.3.1-ubuntu
    container_name: grafana
    hostname: grafana
    volumes:
      - ./grafana.ini:/etc/grafana/grafana.ini
      - ./grafana-datasources.yml:/etc/grafana/provisioning/datasources/default.yml
      - ./grafana-dashboards.yml:/etc/grafana/provisioning/dashboards/default.yml
      - ./grafana-message-count-dashboard.json:/var/lib/grafana/dashboards/grafana-message-count-dashboard.json
    ports:
      - 3000:3000
instance_name = "docker-compose"

[security]
admin_user = "grafana"
admin_password = "grafana"

[unified_alerting]
enabled = false

[alerting]
enabled = false

[plugins]
plugin_admin_enabled = true
---
apiVersion: 1

datasources:
- name: prometheus
  type: prometheus
  access: proxy
  orgId: 1
  uid: prometheus
  url: http://prometheus:9090
  isDefault: true
  version: 1
  editable: false
---
apiVersion: 1

providers:
  - name: local
    orgId: 1
    folder: ''
    folderUid: default
    type: file
    disableDeletion: true
    updateIntervalSeconds: 30
    allowUiUpdates: true
    options:
      path: /var/lib/grafana/dashboards
      foldersFromFilesStructure: true
Dependencies
There are startup dependencies between the Docker containers. For example, the sync domain needs to be running before the participant, and the database needs to run before the sync domain.
The yaml anchor x-logging enabled GELF container logging and is duplicated across the containers where you want to capture logging output. Note that the host address is the host machine, not a network address (on OSX).
x-logging: &logging
  driver: gelf
  options:
    # Should be able to use "udp://logstash:12201"
    gelf-address: "udp://host.docker.internal:12201"

services:

  logstash:
    depends_on:
      elasticsearch:
        condition: service_healthy

  postgres:
    logging:
      <<: *logging
    depends_on:
      logstash:
        condition: service_started

  domain0:
    logging:
      <<: *logging
    depends_on:
      postgres:
        condition: service_healthy
      logstash:
        condition: service_started

  participant1:
    logging:
      <<: *logging
    depends_on:
      domain0:
        condition: service_started
      logstash:
        condition: service_started

  participant2:
    logging:
      <<: *logging
    depends_on:
      domain0:
        condition: service_started
      logstash:
        condition: service_started

  kibana:
    depends_on:
      elasticsearch:
        condition: service_healthy

  grafana:
    depends_on:
      prometheus:
        condition: service_started
Docker Images
The Docker images need to be pulled down before starting the network:
- digitalasset/canton-open-source:2.5.1
- docker.elastic.co/elasticsearch/elasticsearch:8.5.2
- docker.elastic.co/kibana/kibana:8.5.2
- docker.elastic.co/logstash/logstash:8.5.1
- gcr.io/cadvisor/cadvisor:v0.45.0
- grafana/grafana:9.3.1-ubuntu
- postgres:14.8-bullseye
- prom/prometheus:v2.40.6
Running Docker Compose
Since running docker compose with all the compose files shown above creates a long command line, a helper script dc.sh is used.
A minimum of 12GB of memory is recommended for Docker. To verify that Docker is not running short of memory, run docker stats and ensure the total MEM% is not too high.
#!/bin/bash

if [ $# -eq 0 ];then
    echo "Usage: $0 <docker compose command>"
    echo "Use '$0 up --force-recreate --renew-anon-volumes' to re-create network"
    exit 1
fi

set -x

docker compose \
    -p monitoring \
    -f etc/network-docker-compose.yml \
    -f etc/cadvisor-docker-compose.yml \
    -f etc/elasticsearch-docker-compose.yml \
    -f etc/logstash-docker-compose.yml \
    -f etc/postgres-docker-compose.yml \
    -f etc/domain0-docker-compose.yml \
    -f etc/participant1-docker-compose.yml \
    -f etc/participant2-docker-compose.yml \
    -f etc/kibana-docker-compose.yml \
    -f etc/prometheus-docker-compose.yml \
    -f etc/grafana-docker-compose.yml \
    -f etc/dependency-docker-compose.yml \
    $*
Useful commands
./dc.sh up -d       # Spins up the network and runs it in the background

./dc.sh ps          # Shows the running containers

./dc.sh stop        # Stops the containers

./dc.sh start       # Starts the containers

./dc.sh down        # Stops and tears down the network, removing any created containers
Connecting to Nodes
To interact with the running network, a Canton console can be used with a remote configuration. For example:
bin/canton -c etc/remote-participant1.conf
Remote Configurations
canton.remote-domains.domain0 {
  admin-api {
    address="0.0.0.0"
    port="10019"
  }
  public-api {
    address="0.0.0.0"
    port="10018"
  }
}
canton {

  features.enable-testing-commands = yes  // Needed for ledger-api

  remote-participants.participant1 {
    ledger-api {
      address="0.0.0.0"
      port="10011"
    }
    admin-api {
      address="0.0.0.0"
      port="10012"
    }
  }
}
canton {

  features.enable-testing-commands = yes  // Needed for ledger-api

  remote-participants.participant2 {
    ledger-api {
      address="0.0.0.0"
      port="10021"
    }
    admin-api {
      address="0.0.0.0"
      port="10022"
    }
  }

}
Getting Started
Using the previous scripts, you can follow the examples provided in the Getting Started guide.
Kibana Log Monitoring
When Kibana is started for the first time, you must set up a data view to allow view the log data:
- Navigate to http://localhost:5601/.
- Click Explore on my own.
- From the menu select Analytics > Discover.
- Click Create data view.
- Save a data view with the following properties:
- Name: Logs
- Index pattern: logs-*
- Timestamp field: @timestamp
You should now see a UI similar to the one shown here:

In the Kibana interface, you can:
- Create a view based on selected fields
- View log messages by logging timestamp
- Filter by field value
- Search for text
- Query using either KSQL or Lucene query languages
For more details, see the Kibana documentation. Note that querying based on plain text for a wide time window likely results in poor UI performance. See Logging Improvements for ideas to improve it.
Grafana Metric Monitoring
You can log into the Grafana UI and set up a dashboard. The example imports a GrafanaLabs community dashboard that has graphs for cAdvisor metrics. The cAdvisor Export dashboard imported below has an ID of 14282.
- Navigate to http://localhost:3000/login.
- Enter the username/password: grafana/grafana.
- In the side border, select Dashboards and then Import.
- Enter the dashboard ID 14282 and click Load.
- On the screen, select Prometheus as the data source and click Import.
You should see a container system metrics dashboard similar to the one shown here:
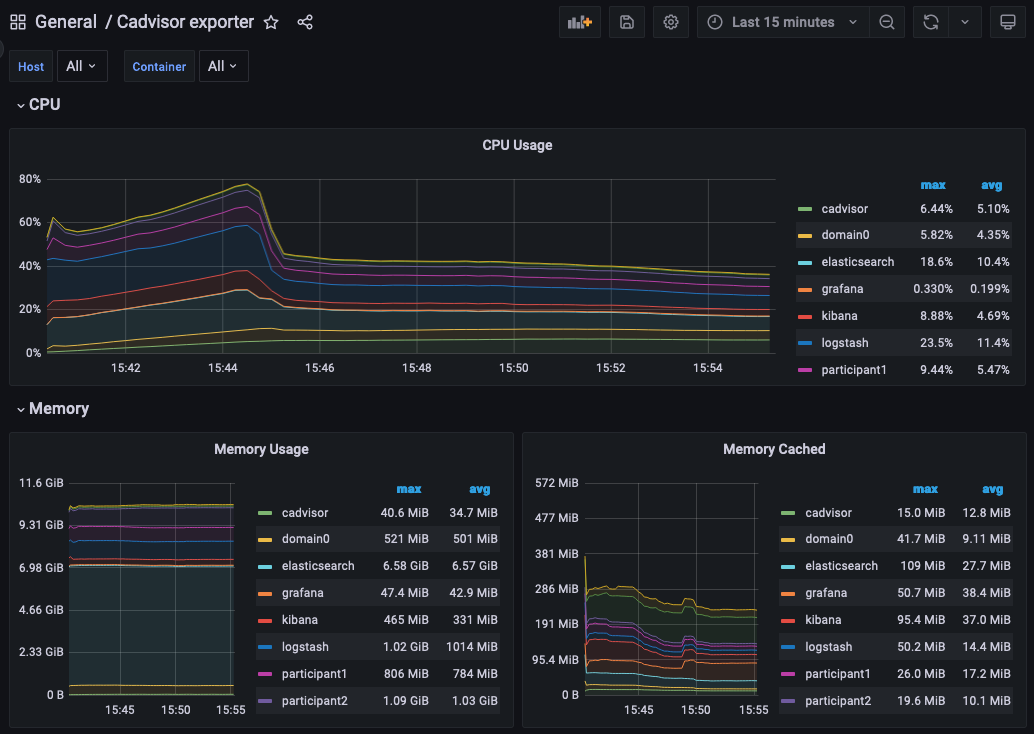
See the Grafana documentation for how to configure dashboards. For information about which metrics are available, see the Metrics documentation in the Monitoring section of this user manual.
Monitoring Choices
This section documents the reasoning behind the technology used in the example monitoring setup.
Use Docker Log Drivers
Reasons:
- Most Docker containers can be configured to log all debug output to stdout.
- Containers can be run as supplied.
- No additional dockerfile layers need to be added to install and start log scrapers.
- There is no need to worry about local file naming, log rotation, and so on.
Use GELF Docker Log Driver
Reasons:
- It is shipped with Docker.
- It has a decodable JSON payload.
- It does not have the size limitations of syslog.
- A UDP listener can be used to debug problems.
Use Logstash
Reasons:
- It is a lightweight way to bridge the GELF output provided by the containers into Elasticsearch.
- It has a simple conceptual model (pipelines consisting of input/filter/output plugins).
- It has a large ecosystem of input/filter and output plugins.
- It externalizes the logic for mapping container logging output to a structures/ECS format.
- It can be run with stdin/stdout input/output plugins for use with testing.
- It can be used to feed Elasticsearch, Loki, or Graylog.
- It has support for the Elastic Common Schema (ECS) if needed.
Use Elasticsearch/Kibana
Reasons:
- Using Logstash with Elasticsearch and Kibana, the ELK stack, is a mature way to set up a logging infrastructure.
- Good defaults for these products allow a basic setup to be started with almost zero configuration.
- The ELK setup acts as a good baseline as compared to other options such as Loki or Graylog.
Use Prometheus/Grafana
Reasons:
- Prometheus defines and uses the OpenTelemetry reference file format.
- Exposing metrics via an HTTP endpoint allows easy direct inspection of metric values.
- The Prometheus approach of pulling metrics from the underlying system means that the running containers do not need infrastructure to store and push metric data.
- Grafana works very well with Prometheus.
Logging Improvements
This version of the example only has the logging structure provided via GELF. It is possible to improve this by:
- Extracting data from the underlying containers as a JSON stream.
- Mapping fields in this JSON data onto the ECS so that the same name is used for commonly used field values (for example, log level).
- Configuring Elasticsearch with a schema that allows certain fields to be quickly filtered (for example, log level).